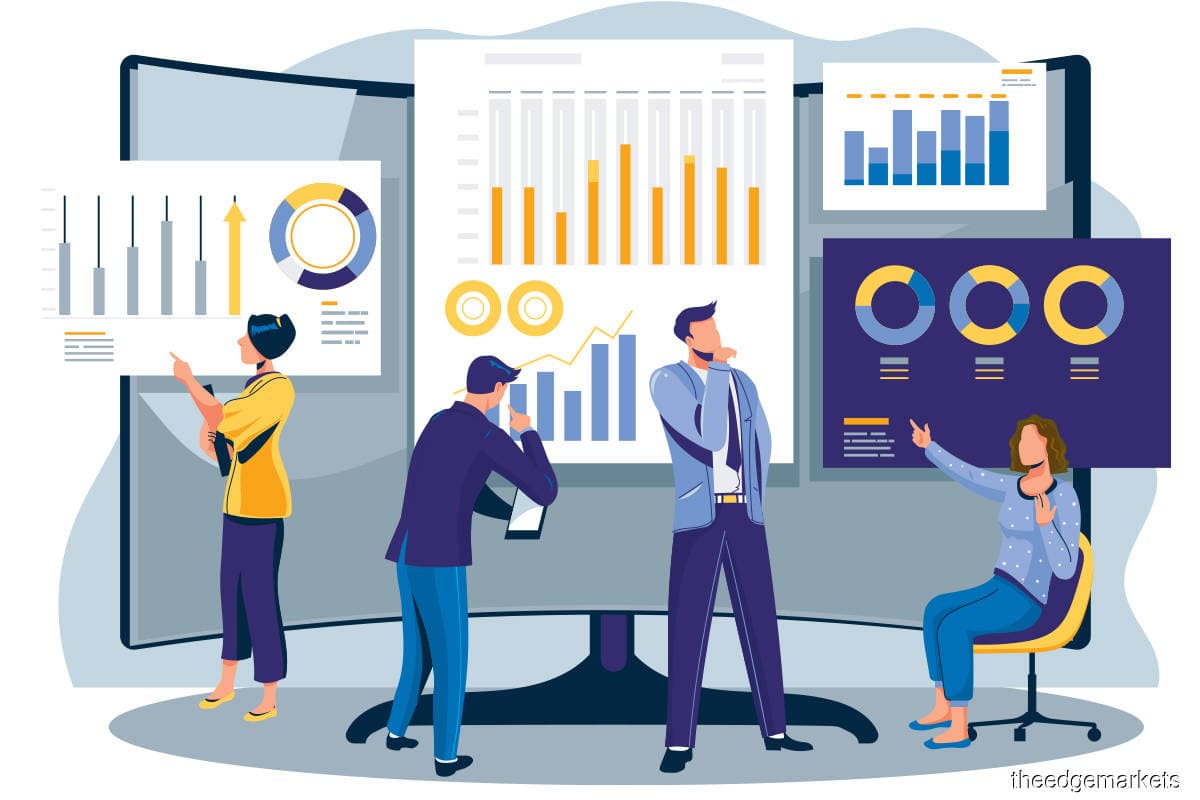
Data-driven decisions have proven to be more efficient and have been used in major fields such as marketing and business. Consequently, using this approach to help educators make the right decision is not surprising. Educators and administrators can use data to assess students’ current level, what they need to learn and can also use this data to help in planning students’ future learning. Data allows educators to create a map that will guide them in their journey toward accomplishing students’ academic goals and school mission and goals. For example, if you are an admin in a school with a majority of ELL students, you will need to collect all the data regarding student ELA score and work on plans to improve student’s English proficiency level.
Data-informed decision plays a great role in teaching mathematics and science. Collecting data formally and informally using summative and formative assessment will allow teachers to discover students’ misconceptions, academic needs and gaps that need to be filled. Research about how to use data from chemistry teaching, done by Harshman and Yezierski (2017), stress the importance of this data as “there is no better source of information for teachers to use to make instructional decisions than data from their own students. Every assignment, homework, quiz, test, activity, lab, in-class question, and discussion yield valuable instructional feedback to high school chemistry teachers.” (p.97). Another use of that data is to help the teacher plan differentiation in every lesson based on his current students’ level. In my opinion data-informed decisions are an intensive process that is necessary and useful.
Personally, I used data collected from students over the years to help in choosing the appropriate sequence of topics. For example, teaching momentum after Newton’s third law allows students to understand it better. Also, adding an introductory math skills unit at the beginning of the physics course improves student’s overall performance. Both quantitative and qualitative data are crucial to make a decision, this includes data collected from standardized testing or teacher’s daily observations. Deciding on the correct tools to use will not be easy as it will change based on the learning environment, teachers’ experience, type of collected data, the reason for collecting data. I think the right tool would be a tool that allows the use of technology to sort data or classify it because this is one of the biggest challenges that educators face when they try to make data driven decisions. It’s safe to say that the best way to collect data is by training teachers on the effective method of data collection and analysis. Collecting is not the biggest obstacle but knowing how to use it is the challenge. Educators need to know why they need that data because “It is easy to become overwhelmed by the sheer volume of data available today. To avoid drowning in data, organizations need to determine what they are trying to achieve and identify which specific questions need to be answered” (Hume & West, 2020).
References
Harshman, J., & Yezierski, E. (2017). Assessment data-driven inquiry: A review of how to use assessment results to inform chemistry teaching. Science Educator, 25(2), 97–107.
Hume, E., & West, A. (2020). Becoming a data-driven decision making organization. CPA Journal, 90(4), 32–35.
Comments
Post a Comment